
US grocery prices increased 0.4% in October 2026, reversing a 0.1% decline in September, according to Consumer Price Index data released by the Bureau of Labor Statistics on 10 November.
The food-at-home index, which measures food purchased for consumption at home, rose as beef, fresh produce, dairy and snacks became more expensive. For supermarkets, the latest figures show how inflation pressures differ across departments rather than moving uniformly throughout the grocery basket.
The wider food index increased 0.5% during October. Prices for food away from home, including restaurant meals, also rose 0.5%. Overall consumer prices rose 0.4% and the index excluding food and energy increased 0.3%, all on a seasonally adjusted monthly basis.
Four of the six major supermarket food groups recorded higher prices. The index for other food at home rose 0.7%, including a 1.0% increase in snacks. Meat, poultry, fish and eggs rose 0.5%, with beef prices up 0.9%.
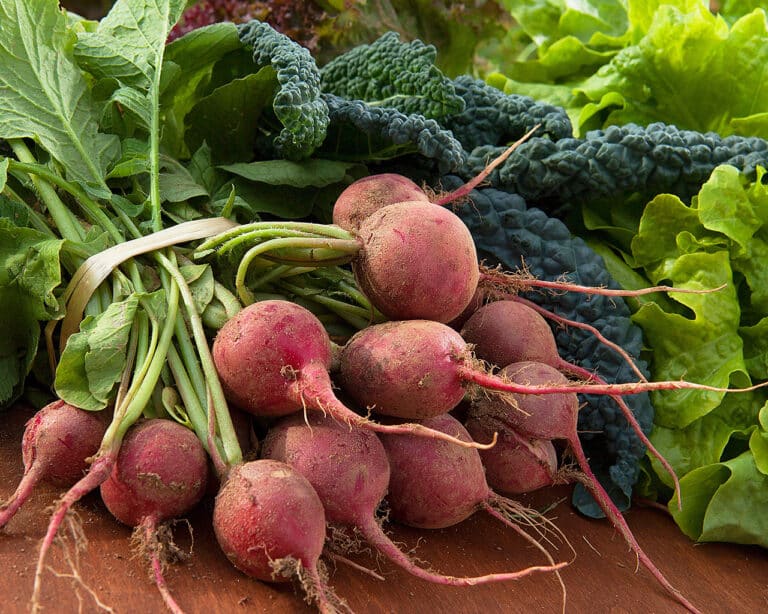
Fruit and vegetables increased 0.6%. Dairy and related products rose by the same amount. Cereals and bakery products were unchanged, while non-alcoholic beverages fell 0.3% after a 0.9% rise in September.
The category breakdown gives supermarket purchasing teams a more useful picture than the headline inflation rate. Beef and dairy buyers face a different short-term price environment from beverage and bakery buyers; retailers cannot assume that all grocery categories require identical price or promotional responses.
October also marked a change from September, when the food-at-home index declined 0.1%. The new figures follow the earlier September US grocery inflation report, but the 0.4% October figure is a month-to-month change, not an annual rate.
That distinction is especially important this month. The Bureau of Labor Statistics said it could not publish most October 2026 12-month inflation comparisons because federal appropriations delays prevented the collection of October 2025 survey data. It would therefore be incorrect to describe this month’s grocery inflation as an annual 0.4% rate or calculate an official 12-month comparison from unavailable base data.
While the October figures establish the direction of retail price movement, they do not establish that wholesalers charged exactly the same percentage more, nor that each supermarket chain raised its shelf prices by the national average. The CPI measures prices paid by consumers at sampled outlets.
Several factors can affect the retail response to input-cost changes, including contracts, inventories, promotions, private-label pricing and competitive pressure. The figures therefore provide a national benchmark for how price changes reach shoppers rather than a direct measurement of individual manufacturers’ margins.
For US grocery suppliers, the most relevant evidence is the variation between product groups. A 1.0% increase for snacks creates different shelf-price and promotional decisions from the 0.3% decline in beverages. The 0.9% monthly increase in beef also deserves close attention for fresh-meat merchandising, although a single month does not establish a lasting trend.
Food away from home rose 0.5%, including a 0.7% increase for full-service meals and 0.4% for limited-service meals. These figures provide additional context as supermarkets compete with restaurants for household food spending.
The price data also matter to US supermarkets managing food inflation, particularly when balancing entry-price products, private-label ranges and promotional investment. A broader price increase can affect shopper value perceptions even if particular departments remain stable.
The Bureau of Labor Statistics uses a sample of retail prices, with seasonal adjustments intended to reduce predictable fluctuations. The monthly movement can be revised as seasonal adjustment factors are updated. Its next CPI release, covering November 2026, is scheduled for 10 December.
For buyers and retail analysts, the immediate priorities are whether the rises in beef, produce, dairy and snacks continue into November, and whether the easing in beverage prices persists. Those next readings will help show whether October represents a wider return to grocery inflation or a shorter category-specific movement.
Editor’s Note: All October percentage changes in this article are seasonally adjusted monthly figures from the US Bureau of Labor Statistics release dated 10 November 2026. Most October year-on-year comparisons are unavailable because the corresponding October 2025 data were not collected.