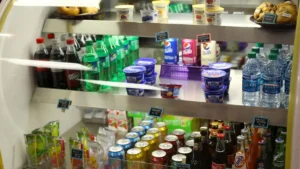
FMCG companies in 2026 are operating in a slower growth environment, where inflation-led expansion has eased and competition from private labels continues to intensify. As a result, global leaders are shifting focus from volume growth to portfolio efficiency, pricing power, and higher-margin categories.
The industry is increasingly defined by health-driven demand, functional products, and tighter supply chain control. At the same time, AI-enabled retail systems and data-led distribution are reducing reliance on traditional brand loyalty, reshaping how products are selected and restocked.
This ranking is based on FY25 revenue (reported or estimated), listed in descending order.
Fast-Moving Consumer Goods (FMCG) refers to everyday essential products such as packaged foods, beverages, personal care, and household goods that are sold quickly and replaced frequently. In 2026, the sector is being reshaped by data-led retail systems, functional nutrition demand, and automated purchasing behaviour.
At-a-Glance: Top 20 US FMCG Leaders (2026)
| Rank | Entity (HQ) | FY25/26 Revenue | Key Impact |
| 01 | Cargill (MN) | $160.0B | Supply chain backbone; ESG leader |
| 02 | Nestlé USA (VA) | $107.7B | PetCare & functional coffee growth |
| 03 | PepsiCo (NY) | $91.8B | Dominant snack-to-drink leverage |
| 04 | P&G (OH) | $84.5B | Utility brand price-elasticity master |
| 05 | Mars, Inc. (VA) | $60.0B | Post-Kellanova snacking powerhouse |
| 06 | JBS USA (CO) | $54.0B | Protein processing & export scale |
| 07 | Unilever USA (NJ) | $52.0B | Personal care and ice cream pivot |
| 08 | AB InBev (MO) | $50.5B | Portfolio diversification into seltzers |
| 09 | Tyson Foods (AR) | $49.2B | Multi-protein recovery specialist |
| 10 | Coca-Cola (GA) | $48.5B | Functional hydration (Fairlife) lead |
| 11 | Starbucks (WA) | $37.1B | CPG coffee & RTD market capture |
| 12 | Mondelēz (IL) | $36.8B | Global snacking “well-being” pivot |
| 13 | Danone NA (NY) | $31.0B | High-protein & plant-based leader |
| 14 | Kraft Heinz (IL) | $26.5B | Flavor-first legacy brand refresh |
| 15 | Dairy Farmers (KS) | $23.0B | Cooperative scale in US dairy |
| 16 | Gen. Mills (MN) | $20.2B | Pet food and breakfast optimization |
| 17 | Colgate (NY) | $19.9B | Oral care tech & specialized hygiene |
| 18 | Land O’Lakes (MN) | $16.5B | Farm-to-retail vertical integration |
| 19 | Keurig Dr P. (MA) | $15.5B | Beverage system innovation |
| 20 | Hershey Co. (PA) | $11.5B | Salty-sweet snacking diversification |
01 Cargill (Wayzata, MN)
Founded: 1865
HQ: Minnesota, USA
FY25 Revenue: $154.0B
Employees: 160,000
Core Segments: Animal Protein, Food Ingredients & Bio-industrial, Agricultural Supply Chain
Cargill sits at the core of the US food system, supplying key ingredients, processing, and meat infrastructure for major FMCG companies. In 2026, its role is shifting toward Scope 3 and supply chain decarbonisation. Despite a softer cattle cycle, diversification and control over logistics help protect margins and reinforce its role in US food security.
Key data: Around 25% of US grain exports and nearly 22% of the domestic meat market.
02 Nestlé USA (Arlington, VA)
Founded: 1866 (Global) / Arlington, VA (US HQ)
HQ: Virginia, USA
FY25 Revenue: $107.7B (Global Total / US-Weighted Focus)
Employees: 30,000+ (US)
Core Segments: PetCare (Purina), Coffee, Prepared Foods, Health Science
Nestlé USA is focusing on high-margin categories like coffee, pet care, and functional nutrition. In 2026, its strategy centres on “better-for-you” products and strong positions in coffee and pet care. Portfolio shifts away from lower-value segments and growth in functional foods continue to support performance.
Key data: Around 40% of prepared foods growth comes from high-protein and functional products.
03 PepsiCo (Purchase, NY)
Founded: 1965
HQ: New York, USA
FY25 Revenue: $94.0B
Employees: 318,000
Core Segments: Frito-Lay North America, Beverages, Quaker Foods
PepsiCo combines a strong direct-store-delivery network with growing demand for snacks and convenient foods. In 2026, AI-driven supply chain tools and a focus on portion control and functional products are shaping growth. Frito-Lay remains the key profit driver, supporting overall performance despite shifting consumer habits. Key data: North American snacks generate over 50% of operating profit while representing less than 30% of volume.
04 Procter & Gamble (Cincinnati, OH)
Founded: 1837
HQ: Ohio, USA
FY25 Revenue: $84.5B
Employees: 107,000
Core Segments: Fabric & Home Care, Baby Care, Feminine & Family Care, Beauty & Grooming
P&G leads with a data-driven supply chain tightly linked to retailer sales data, strengthening its role in category management across FMCG aisles. In 2026, its “Irresistible Superiority” strategy supports premium pricing through continuous product upgrades, helping maintain market share against private labels. The company is also expanding retail media integration using real-time consumer data. Key data: Premium pricing strategy allows 20–30% higher price points than private labels while sustaining share.
05 Mars, Inc. (McLean, VA)
Founded: 1911
HQ: Virginia, USA
FY25 Revenue: $60.0B (Post-Kellanova Integration)
Employees: 150,000+
Core Segments: Snacking, Petcare, Food & Nutrition
Mars has evolved into a diversified snacking powerhouse after integrating Kellanova assets, strengthening its position across confectionery and savory snacks. In 2026, it operates a unified snacking division with major brands across both sweet and salty categories, boosting shelf control and retail influence. Its private ownership structure supports long-term investment in supply chain resilience. Key data: Around 15% share of the US snacking market post-integration.
06 JBS USA (Greeley, CO)
Founded: 1953 (Global) / US HQ: Greeley, Colorado
HQ: Colorado, USA
FY25 Revenue: $54.0B (US) / $86.2B (Global)
Employees: 66,000 (US)
Core Segments: Beef, Pork, Poultry, Prepared Foods
JBS USA is a leading protein processor focused on beef, pork, and poultry, with growing investment in branded and prepared foods. In 2026, it is shifting toward higher-margin products like fully cooked chicken to reduce exposure to raw commodity volatility. Strong poultry performance helps offset pressure in beef markets.
Key data: Branded prepared foods now account for around 20% of US revenue, up from 12% in 2022.
07 Unilever USA (Englewood Cliffs, NJ)
Founded: 1929 (Global Merger) / US HQ: New Jersey
HQ: New Jersey, USA
FY25 Revenue: $52.0B (US Est.) / €50.5B (Global)
Employees: 8,000+ (US)
Core Segments: Beauty & Wellbeing, Personal Care, Home Care, Nutrition
Unilever USA has repositioned itself as a focused hygiene and personal care business after streamlining food and ice cream operations. In 2026, its portfolio is centred on high-margin “Power Brands” like Dove and Vaseline, supported by heavy investment in digital and influencer-driven marketing. The shift has reduced commodity exposure and strengthened margins.
Key data: Around 67% of US revenue now comes from beauty and personal care.
08 Anheuser-Busch InBev (St. Louis, MO)
Founded: 1852
HQ: St. Louis, Missouri (North American Zone)
FY25 Revenue: $59.3B (Global) / ~$15.5B (US Zone)
Employees: 19,000 (US)
Core Segments: Beer, Ready-to-Drink (RTD), Digital B2B Platform
AB InBev is expanding beyond beer into RTD and digital distribution, supported by its BEES platform and data-led retail execution. In 2026, growth is driven by premium and “beyond beer” categories like Michelob Ultra and Cutwater, alongside strong bar and restaurant presence. The company is increasingly data-focused across its supply chain.
Key data: Michelob Ultra leads US volume strength, contributing significantly to total industry share.
09 Tyson Foods (Springdale, AR)
Founded: 1935
HQ: Arkansas, USA
FY25 Revenue: $52.9B
Employees: 139,000
Core Segments: Chicken, Beef, Pork, Prepared Foods
Tyson Foods is shifting from commodity meat processing to branded, convenience-driven protein products. In 2026, strong poultry performance and growth in prepared foods are helping offset pressure in beef markets. Innovation in high-protein, ready-to-eat products is driving consumer demand.
Key data: Prepared foods margins reached nearly 13% in Q1 2026, outperforming core meat segments.
10 Coca-Cola Co. (Atlanta, GA)
Founded: 1886
HQ: Georgia, USA
FY25 Revenue: $47.9B
Employees: 79,000
Core Segments: Sparkling Soft Drinks, Water/Sports/Coffee/Tea, Juice/Value-Added Dairy (fairlife)
Coca-Cola is shifting from a soda-led business to a broader beverage platform, with growth driven by Coca-Cola Zero Sugar and fairlife protein milk. In 2026, its focus is on digital-first marketing and functional, value-added drinks. The company is also leaning into smaller-pack formats and personalised campaigns.
Key data: Coca-Cola Zero Sugar grew 14% in 2025.
11 Starbucks (CPG) (Seattle, WA)
Founded: 1971
HQ: Washington, USA
FY25 Revenue: $37.2B (Consolidated) / ~$6.9B (North America Segment)
Employees: 400,000+ (Global)
Core Segments: At-Home Coffee, RTD Beverages, Licensed Store Operations
Starbucks has expanded its coffee brand beyond cafés into a strong CPG and RTD business through its alliance with Nestlé. In 2026, growth is driven by premium at-home coffee and cold beverage innovation, supported by asset-light production. The strategy focuses on maintaining premium positioning across retail and grocery channels.
Key data: At-home and RTD coffee segments account for nearly 25% of US premium coffee sales.
12 Mondelēz International (Chicago, IL)
Founded: 2012 (Kraft Foods split)
HQ: Illinois, USA
FY25 Revenue: $38.5B (Global)
Employees: 91,000
Core Segments: Biscuits, Chocolate, Baked Snacks
Mondelēz is doubling down on core snack categories like biscuits and chocolate while exiting non-core assets. In 2026, its growth is supported by strong brand equity in Oreo and expansion in snack bars and baked snacks. Despite cocoa price pressure, pricing power and brand strength remain key advantages.
Key data: Snack bars rank among the fastest-growing segments, now holding ~8.6% global share.
13 Danone North America (White Plains, NY)
Founded: 1919 (Global) / US HQ: New York
HQ: New York, USA
FY25 Revenue: $32.2B (Global) / ~$6.5B (North America Segment)
Employees: 5,000 (US)
Core Segments: Dairy & Plant-Based, Specialized Nutrition, Coffee Creamers
Danone North America is focused on high-protein dairy, plant-based nutrition, and medical-grade food innovation. In 2026, growth is driven by protein-rich products and expansion into specialized nutrition through recent acquisitions. The company is positioned strongly in the “health-through-food” category.
Key data: Specialized nutrition grew 7.4% in 2025, outpacing wider FMCG growth trends.
14 Kraft Heinz (Chicago, IL)
Founded: 2015 (Merger)
HQ: Illinois, USA
FY25 Revenue: $24.9B
Employees: 35,000 (Global)
Core Segments: Taste Elevation (Heinz, Philadelphia), North American Grocery (Oscar Mayer, Lunchables, Kraft Mac & Cheese)
Kraft Heinz is restructuring its business into separate growth and legacy units, splitting higher-growth condiments from slower-moving grocery brands. In 2026, the focus is on efficiency and price-pack optimisation to protect demand in inflationary conditions. The Heinz portfolio remains the key global strength.
Key data: Heinz continues to anchor strong pricing power across international foodservice channels.
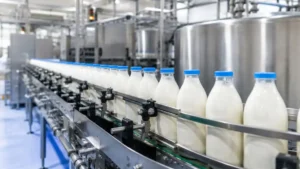
15 Dairy Farmers of America (Kansas City, KS)
Founded: 1998
HQ: Kansas, USA
FY25 Revenue: $23.0B (Est.)
Employees: 19,000+
Core Segments: Fluid Milk, Cheese, Butter, Dairy Ingredients
Dairy Farmers of America is the largest US dairy cooperative, handling a major share of national milk supply and expanding into high-value dairy ingredients. In 2026, it is increasingly focused on protein-rich products like whey and non-fat dry milk, supporting demand from nutrition and food manufacturing sectors. The shift strengthens its role beyond traditional fluid milk.
Key data: DFA processes nearly 30% of total US milk supply.
16 General Mills (Minneapolis, MN)
Founded: 1866
HQ: Minnesota, USA
FY25 Revenue: $20.1B
Employees: 34,000
Core Segments: Retail Foods, Pet Food (Blue Buffalo), International, Foodservice
General Mills is streamlining its portfolio by exiting lower-growth categories and focusing on strong brands in cereal and pet food. In 2026, growth is increasingly driven by Blue Buffalo and premium pet nutrition, while cost savings are redirected into higher-margin segments. The strategy prioritises brand strength over volume.
Key data: Pet food remains one of the company’s most stable and high-margin growth engines.
17 Colgate-Palmolive (New York, NY)
Founded: 1806
HQ: New York, USA
FY25 Revenue: $20.4B
Employees: 33,600
Core Segments: Oral Care, Personal Care, Home Care, Pet Nutrition (Hill’s)
Colgate-Palmolive runs a highly digital, AI-supported supply chain that enables real-time production and demand alignment across global markets. In 2026, its focus is on operational efficiency and retailer data integration through advanced planning systems. Strong oral care leadership and a high-margin pet nutrition business remain key anchors.
Key data: Around 41% global share in toothpaste.
18 Land O’Lakes (Arden Hills, MN)
Founded: 1921
HQ: Minnesota, USA
FY25 Revenue: $16.5B (Est.)
Employees: 9,000+
Core Segments: Dairy Foods, Animal Nutrition, Crop Inputs
Land O’Lakes is a diversified farmer-owned cooperative spanning dairy, animal feed, and agricultural inputs. In 2026, it is increasingly focused on sustainability through its Truterra platform, which monetises regenerative farming and carbon reduction. The model strengthens its role across both farming and FMCG supply chains.
Key data: Truterra has enabled large-scale carbon sequestration programs across US farms.
19 Keurig Dr Pepper (Burlington, MA)
Founded: 2018 (Merger)
HQ: Massachusetts, USA
FY25 Revenue: $16.6B
Employees: 28,000
Core Segments: Refreshment Beverages, Coffee (K-Cup), International
Keurig Dr Pepper is undergoing a major structural shift, separating its beverage and coffee businesses to unlock value. In 2026, growth is driven by strong soft drink performance and data-led distribution through its direct-store-delivery network. Dr Pepper continues to gain share in the US carbonated drinks market.
Key data: Dr Pepper holds the #2 position in US carbonated soft drinks by volume.
20 Hershey Co. (Hershey, PA)
Founded: 1894
HQ: Pennsylvania, USA
FY25 Revenue: $11.7B
Employees: 19,000
Core Segments: Confectionery, Salty Snacks, Functional Snacks
Hershey is expanding beyond chocolate into broader snack categories to reduce reliance on volatile cocoa markets. In 2026, growth is being driven by salty snacks and “better-for-you” products following key acquisitions and product expansion. The company is repositioning itself as a multi-category snacking business.
Key data: North America salty snacks grew 28% in 2026, led by portfolio expansion.
2026 Industry Outlook: The “Precision” Era
As we look toward the remainder of 2026, the US FMCG sector is defined by three unavoidable truths:
The GLP-1 Tail: Health is a Mandate, Not a Trend. Companies like Nestlé and Danone that pivoted early to high-protein, functional nutrition are seeing stronger valuation multiples than legacy-heavy peers.
AI-Restocking is the New Shelf Space. The top 20 are no longer competing only for shelf visibility but for inclusion in automated retail ordering systems. Brands not integrated into retailer AI inventory platforms risk losing placement over time.
M&A as a Survival Tool. Deals such as Mars–Kellanova and Keurig Dr Pepper’s structural split highlight how scale and specialization are being used to defend margins against commodity and input-cost pressure.
US Supermarket Landscape. Private label expansion continues to pressure branded players, with retailers strengthening in-house ranges across value and premium tiers, narrowing the gap in categories like dairy, snacks, and household essentials.
US FMCG Sector. Growth is increasingly driven by functional products, pricing architecture, and data-led retail execution rather than pure volume expansion.
US Packaging Industry. Demand is shifting toward sustainable, lightweight, and compliance-ready materials, as FMCG players align packaging design with cost efficiency and environmental targets.
It is important to note that the US FMCG market extends well beyond the companies featured in this ranking. Hundreds of smaller and mid-sized manufacturers operate across categories including organic foods, dairy, beverages, snacks, personal care, and household products.
Companies such as Organic Valley, Bob’s Red Mill, Chobani, Nature’s Path, and numerous regional brands play important roles within their respective niches. However, this ranking focuses on the largest FMCG companies by revenue, market influence, distribution scale, and strategic impact on the US consumer goods sector.
Editor’s Note: Data in this report is compiled from 2025 annual filings, Q1 2026 guidance, and verified trade announcements as of April 17, 2026.